6. Grouping data and creating pivot tables with Pandas
In this lesson you will learn how to group data together in a DataFrame and create summary statistics of the grouped data. You will also learn how to reshape a DataFrame, and create a pivot table.
For this lesson we will use the following data of (fake) exam scores:
import pandas as pdexams_data ='https://raw.githubusercontent.com/mafudge/datasets/refs/heads/master/exam-scores/exam-scores.csv'exams = pd.read_csv(exams_data)exams.sample(10)
Class_Section
Exam_Version
Completion_Time
Made_Own_Study_Guide
Did_Exam_Prep Assignment
Studied_In_Groups
Student_Score
Percentage
Letter_Grade
62
M02
D
45
?
?
?
24
80.00%
B
64
M02
D
60
N
N
Y
24
80.00%
B
0
M01
A
20
N
N
Y
24
80.00%
B
7
M01
B
15
Y
Y
Y
26
86.70%
B+
44
M02
B
45
Y
Y
Y
25
83.30%
B
26
M01
D
60
Y
Y
N
19
63.30%
C-
39
M02
B
15
N
N
Y
19
63.30%
C-
46
M02
B
55
Y
N
N
17
56.70%
D
23
M01
D
35
?
?
?
13
43.30%
F
52
M02
C
40
Y
Y
N
16
53.30%
D
To follow along with the commands below, download the following scratch notebook to your ist356 directory, then open it with VS Code:
With large data sets we frequently want to group common data together and summarize those groups in some way. For example, you might want to know:
Average exam score by section
Number of students who took each exam
Average grade based on whether students studied in groups
Total completion time by letter grade
The Pandas groupby method allows us to quickly group data like this. Using it involves two steps:
Run the groupby method on a dataframe, giving it a column or list of columns to group the data by.
The groupby method returns an DataFrameGroupBy object. On its own, this object isn’t terrible informative. To get something useful, we then use the aggregate method (agg) to summarize the grouped data and display it as a DataFrame. When aggregating the data, we need to provide the name of an operation (sum, min, max, mean, std, quartile, count) by which to summarizie the data.
Here’s an example using our exams data:
# Example: Total number of exams take by section and the average score in each section:exams_by_section = exams.groupby(by=['Class_Section']).agg({ 'Class_Section': 'count', 'Student_Score': 'mean' })exams_by_section
Class_Section
Student_Score
Class_Section
M01
29
23.000000
M02
36
22.527778
Here, we’ve chosen to group the exams by the class section. We’ve then produced a DataFrame in which the class sections are summarized by the number of students and their average score. The column names are a little confusing, however. Let’s rename them to make the output more readable:
Create a Streamlit app that will load the exams csv file above and will allow the user to select one of the following: Made_Own_Study_Guide, Did_Exam_Prep Assignment, Studied_In_Groups. After the selection is made, display a dataframe that summarizes the count of students and the average student score for the selection.
Hint: For offering the selection, use Streamlit’s selectbox method.
pivot makes “long” data “wide” moving rows into columns.
melt makes “wide” data “long” moving columns into rows. Basically, the opposite of pivot.
Note
These functions only move data, they are unable to summarize it.
The intersection of row/column must contain a single value. Multiple values under the same row/column will fail.
To set this up this example from exams let’s create a dataframe that summarizes the data. We will add the index columns back to the dataframe for clarity. Please note this is not something that needs to be done typically. We are just re-using the dataset for this example. (In fact, the following block of code is basically creating a pivot table from the exams data. We’ll see how to create pivot tables using a much simpler way below.)
# Get average scores by section and exam version:avg_scores_by_section_and_version = exams.groupby( by=['Class_Section', 'Exam_Version']).agg({'Student_Score': 'mean'})# add section and exam version back to dataframeavg_scores_by_section_and_version['Class_Section'] = avg_scores_by_section_and_version.index.get_level_values('Class_Section')avg_scores_by_section_and_version['Exam_Version'] = avg_scores_by_section_and_version.index.get_level_values('Exam_Version')# reset the indexavg_scores_by_section_and_version = avg_scores_by_section_and_version.reset_index(drop=True)#rename the Student_score to average scoreavg_scores_by_section_and_version = avg_scores_by_section_and_version.rename(columns={'Student_Score': 'Average_Score'})#reorder the columnsavg_scores_by_section_and_version = avg_scores_by_section_and_version[['Class_Section', 'Exam_Version', 'Average_Score']]#showavg_scores_by_section_and_version
Class_Section
Exam_Version
Average_Score
0
M01
A
25.428571
1
M01
B
23.571429
2
M01
C
23.714286
3
M01
D
19.750000
4
M02
A
22.400000
5
M02
B
23.222222
6
M02
C
21.777778
7
M02
D
22.750000
Pivot()
Let’s pivot this data two different ways:
exam_version_in_col - a pivot where the exam version is in the column
class_section_in_col - a pivot where the class section is in the column
The pd.pivot_table() function combines a groupby() with a pivot(). Its intended for when you need to pivot and aggregate in the pivot, avoiding a lot of extra code such as adding indexes as columns (as we had to above).
Here’s the examples above, but with a pivot_table on the original examsdata. We can skip the processing building avg_scores_by_section_and_version because pivot_table() allows us to summarize data.
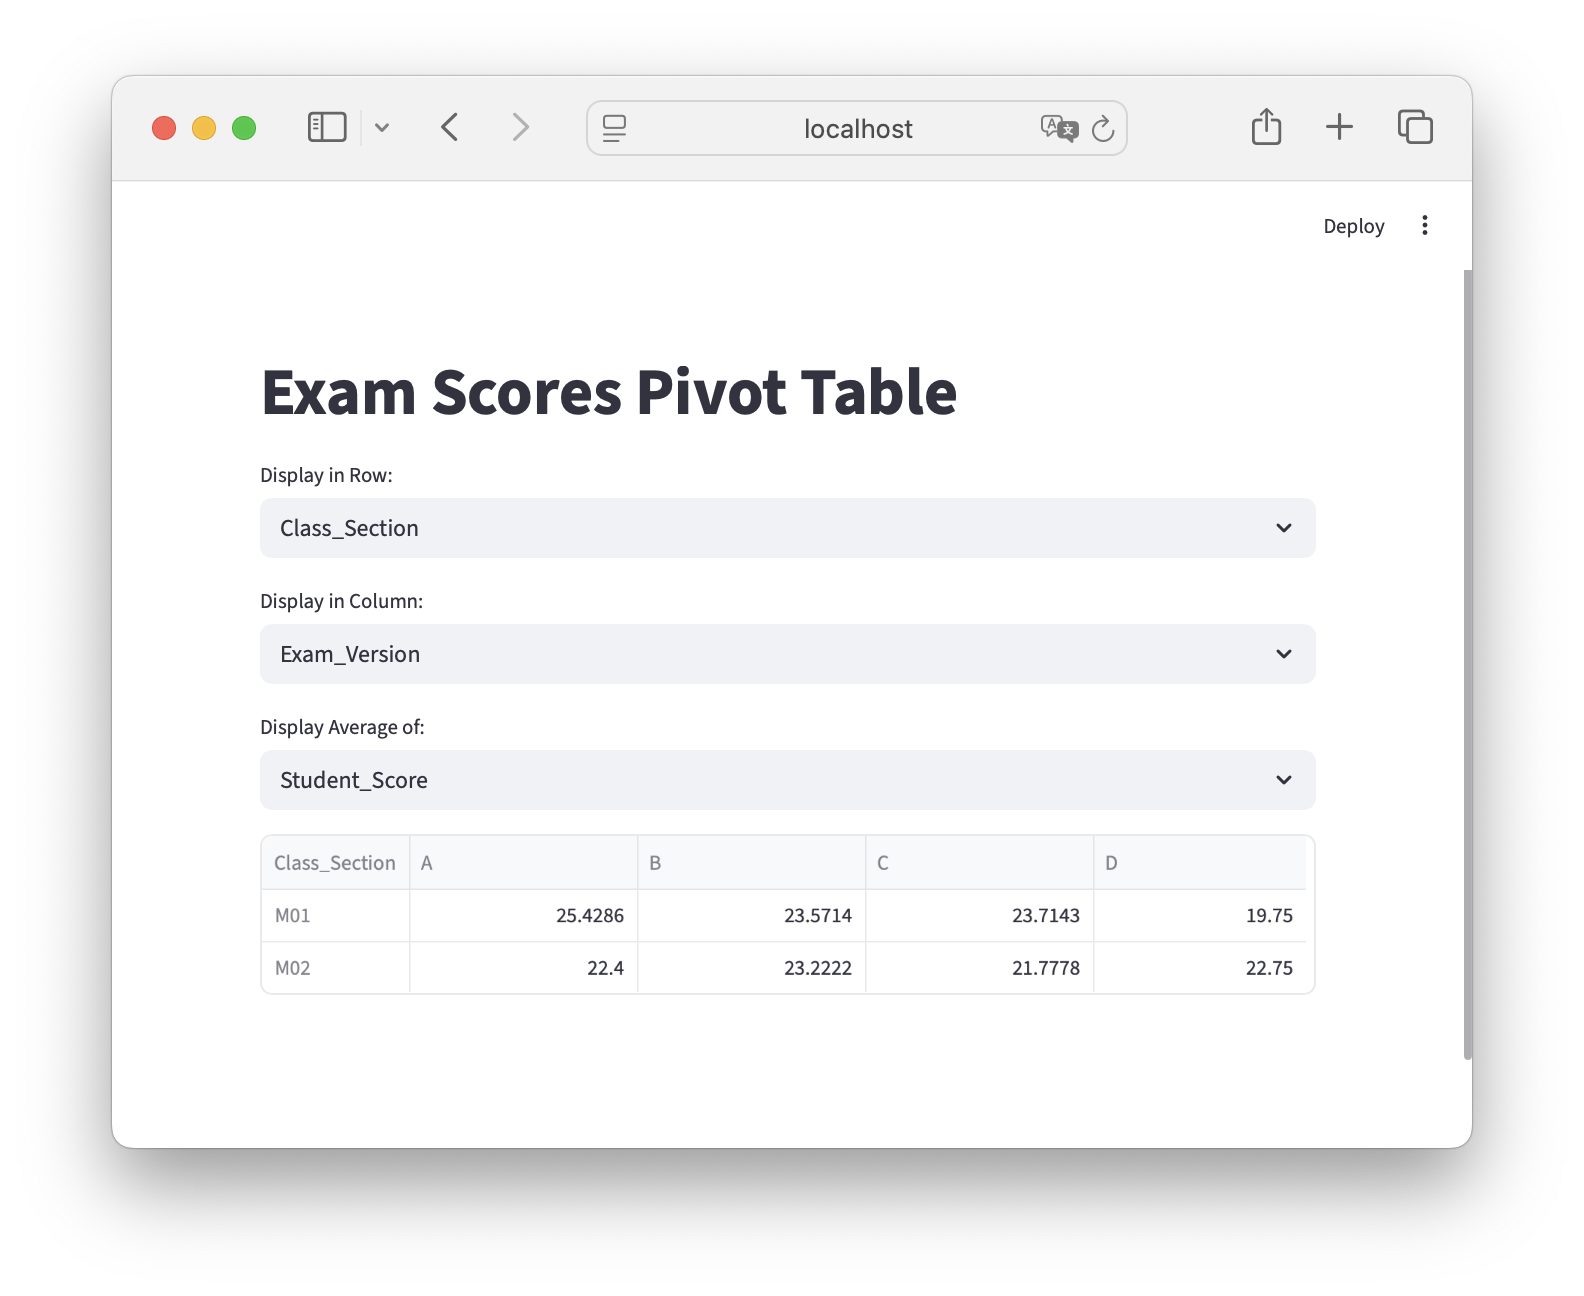
Add another selection widget that allows the user to select which field to display in the columns. Note: you will need to remove the field the user selected for the row in the list of options, else you’ll get an error if they select the same field twice.
Create another selection widget that allows the user to select what data to populate the pivot table with. The pivot table should display the average of the selected value. The options for the displayed data should be:
measures = ['Completion_Time','Student_Score']
Build the pivot table dataframe from the inputs. Use the average for the aggfunc
Display the pivot table.
Here’s a screen shot of what your app should like:
import streamlit as stimport pandas as pdst.title("Exam Scores Pivot Table")# load the data: we'll only do this once, then cacheif'exams'notin st.session_state: st.session_state.exams = pd.read_csv('https://raw.githubusercontent.com/mafudge/datasets/refs/heads/master/exam-scores/exam-scores.csv')# set up the optionsfields = [ 'Class_Section', 'Exam_Version', 'Made_Own_Study_Guide', 'Did_Exam_Prep Assignment', 'Studied_In_Groups','Letter_Grade']measures = ['Student_Score', 'Completion_Time']row = st.selectbox('Display in Row:', fields)fields.remove(row)col = st.selectbox('Display in Column:', fields)value = st.selectbox('Display Average of:', measures)pivot_df = st.session_state.exams.pivot_table(index=row, columns=col, values=value, aggfunc='mean')st.dataframe(pivot_df)